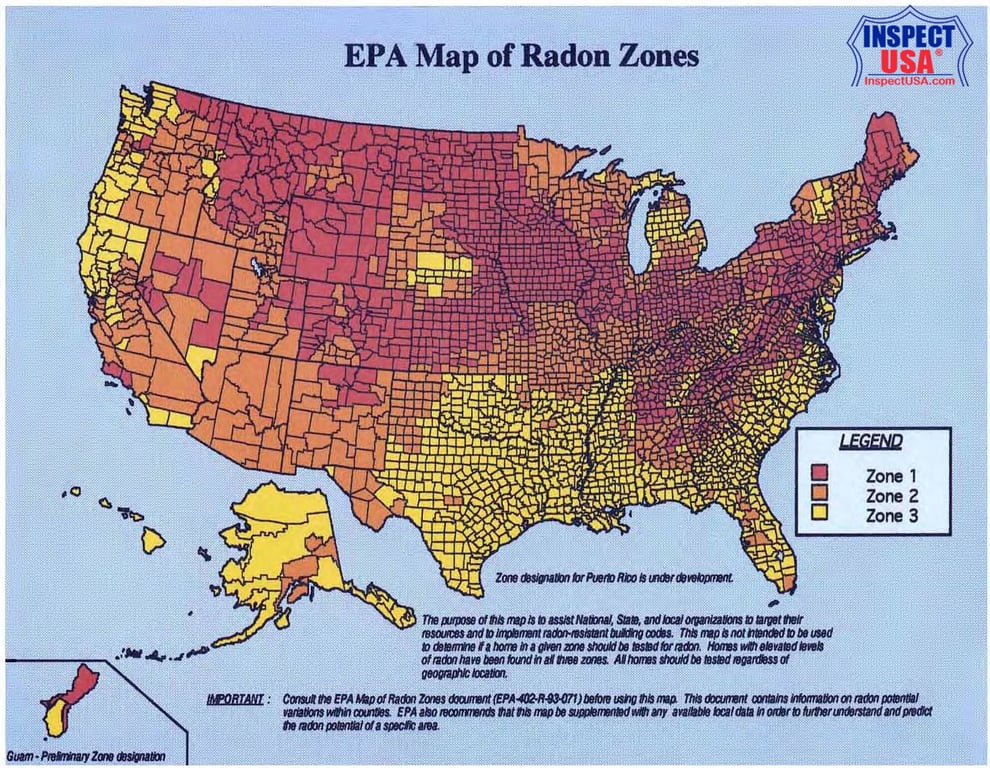
EPA Map of Radon Zones
The Map was developed using five factors to determine radon potential: indoor radon measurements, geology, aerial radioactivity, soil permeability and foundation type. Radon potential assessment is based on geologic provinces. Radon Index Matrix is the quantitative assessment of radon potential. Confidence Index Matrix shows the quantity and quality of the data used to assess radon potential. Geologic Provinces were adapted to county boundaries for the Map of Radon Zones.
Sections 307 and 309 of the Indoor Radon Abatement Act of 1988 (IRAA) directed EPA to list and identify areas of the U.S. with the potential for elevated indoor radon levels. EPA's Map of Radon Zones assigns each of the 3,141 counties in the U.S. to one of three zones based on radon potential:
- Zone 1 counties have a predicted average indoor radon screening level greater than 4 pCi/L (picocurries per liter) (red zones)
- Zone 2 counties have a predicted average indoor radon screening level between 2 and 4 pCi/L (orange zones)
- Zone 3 counties have a predicted average indoor radon screening level less than 2 pCi/L (yellow zones)
You can view your State's radon potential map by clicking on your State below the map.
US States Index to Radon Gas Concentration Maps
The purpose of this map is to assist National, State, and local organizations to target their resources and to implement radon-resistant building codes. This map is not intended to be used to determine if a home in a given zone should be tested for radon. Homes with elevated levels of radon have been found in all three zones. All homes should be tested regardless of geographic location.